In Linux debugging, adding printk and other printing functions can solve most of the problems. In the default Linux code, you can often see more advanced macros that encapsulate printk(), such as dev_info(), dev_dbg(), pr_info(), pr_debug(), etc. However, some information is not output to the console (serial port). This article takes i.MX8MP EVK, L6.1.36 Linux version as an example to list some common debugging methods in Linux using printk:
• Printk level definition, how to adjust the log level
• Dynamic debug: When running Linux, the dev_dbg, pr_debug, etc. of the specified driver file are output to the console (serial port)
• Static debug: When compiling the kernel, the dev_dbg, pr_debug, etc. of the specified driver file are output to the console (serial port)
• Modify the kernel top-level Makefile to output the dev_dbg, pr_debug, etc. of all driver files to the console (serial port)
• Use initcall_debug to track initcall
• Debug of other modules: Such as drm debug
• Manual WARN_ON(1), BUG_ON (1) to view the stack backtrace
1. Book the board:
2. Printk level definition, how to adjust the log level:
The kernel print statement printk() will output kernel information to the kernel information buffer, which is a ring buffer. If too many messages are put into it, the previous messages will be flushed out. The Linux kernel can expand the buffer size by adjusting the CONFIG_LOG_BUF_SHIFT macro.
Printk() defines 8 message levels, 0 to 7. The larger the value is, the lower the level and the less important the message. Level 0 is an emergency and level 7 is a debug level.
vi include/linux/kern_levels.h
#definKERN_EMERG KERN_SOH "0" /* system is unusable */
#define KERN_ALERT KERN_SOH "1" /* action must be taken immediately */
#define KERN_CRIT KERN_SOH "2" /* critical conditions */
#define KERN_ERR KERN_SOH "3" /* error conditions */
#define KERN_WARNING KERN_SOH "4" /* warning conditions */
#define KERN_NOTICE KERN_SOH "5" /* normal but significant condition */
#define KERN_INFO KERN_SOH "6" /* informational */
#define KERN_DEBUG KERN_SOH "7" /* debug-level messages */e
Among them, KERN_EMERG (level 0) is an emergency event, usually the information appear before the system crashes. KERN_ERR (level 1) is used to report error status, and device drivers often use this level of printing to report the hardware problems. KERN_INFO (level 6) is kernel prompt information, and drivers often use this level of printing to report hardware information when starting. KERN_DEBUG (level 7) is debugging information.
Users can directly use printk without flags to print. The default priority is 4, that is, directly printk("XXX");. You can also choose to add a print level, such as using printk(KERN_DEBUG "XXX"); or printk(KERN_INFO "XXX").
When printing, you can use __func__ to output the function name where printk is located, use __LINE__ to output the line number of the code, and use __FILE__ to output the file name of the source code.
For example, compile the kernel source code according to "Compile the kernel image and run it on the AIoT lab development board.docx", and add the following print to the source code:
git diff
diff --git a/drivers/gpu/drm/bridge/sec-dsim.c b/drivers/gpu/drm/bridge/sec-dsim.c
index fc9ca98f6ef7..ea5fbec61209 100644
--- a/drivers/gpu/drm/bridge/sec-dsim.c
+++ b/drivers/gpu/drm/bridge/sec-dsim.c
@@ -1146,6 +1146,9 @@ struct dsim_pll_pms *sec_mipi_dsim_calc_pmsk(struct sec_mipi_dsim *dsim)
struct sec_mipi_dsim_range pr_new = *prange;
struct sec_mipi_dsim_range sr_new = *srange;
+ printk(KERN_INFO "sec_mipi_dsim_calc_pmsk start, function name is %s,\
+ line is %d, file name is %s\n ", __func__, __LINE__, __FILE__ );
+
pll_pms = devm_kzalloc(dev, sizeof(*pll_pms), GFP_KERNEL);
if (!pll_pms) {
dev_err(dev, "Unable to allocate 'pll_pms'\n");
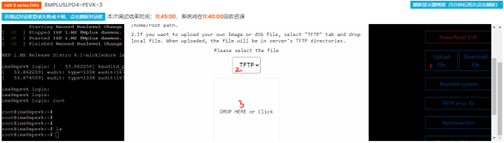
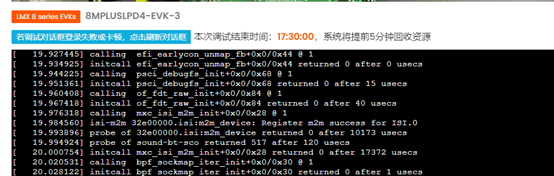
Upload the compiled kernel Image to the TFTP directory of the 8MPLUSLPD4-PEVK-3 development board in the following way.
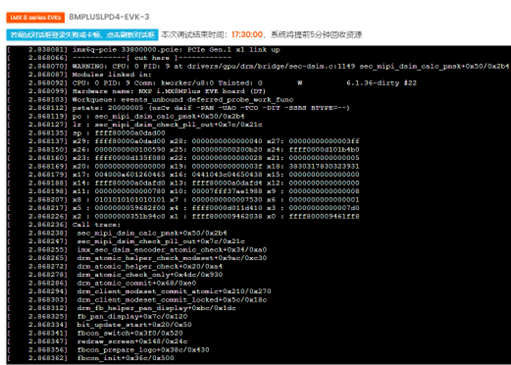
Then click the PowerReset EVK button to restart the development board. You can see the following printout. This can be used as a debugging method.

The output level of printk() can be checked by running the following command:
cat /proc/sys/kernel/printk

The result has 4 values, they are:
(1) The log level of the console (usually the serial port), console_loglevel: the current printing level. Logs with a higher priority than this value will be printed to the console.
(2) Default message level, default_message_loglevel: Print messages without priority prefix, that is, directly printk("XXX"); messages. The default value is controlled by the kernel macro CONFIG_MESSAGE_LOGLEVEL_DEFAULT, the default value is 4, and the value range is 1~7.
(3) Minimum console log level, minimum_console_loglevel: The minimum value that the console log level can be set to (usually 1).
(4) Default console log level, default_console_loglevel: The default value of the console log level. The default value is controlled by the kernel macro CONFIG_CONSOLE_LOGLEVEL_DEFAULT, the default value is 7, and the value range is 1~15.
The following command can be used to modify the log level of the console. The following command changes it to 8:
echo 8 4 1 7> /proc/sys/kernel/printk
或者以下命令:
dmesg -n 8
In the Linux default code, you will often see more advanced macros that call printk, such as dev_info, dev_dbg, pr_info, pr_debug, etc. However, some information is not output to the console (serial port).
Take i.MX8MP EVK, L6.1.36 Linux version as an example. If the default Linux kernel is used, during the boot process and when viewing the boot information using dmesg, you can see that pr_debug(), dev_dbg(), and printk(KERN _DEBUG "XXX"); and other information are not output to the console (serial port). That is, the debugging information of KERN_DEBUG (level 7) is not output to the serial port. The debugging information of message levels 0~6 can be output to the serial port.
Sometimes when debugging the Linux kernel, we want to output information such as pr_debug(), dev_dbg(), and printk(KERN DEBUG "XXX") of certain files to the console (serial port). How to do it? At this time, we need to use dynamic debug or static debug.
3. Dynamic debug:
The Dynamic debug (dyndbg) function allows user space to dynamically control the opening and closing of the Linux kernel KERN_DEBUG type log at runtime, through the file node /sys/kernel/debug/dynamic_debug/control exported by debugfs.
When dynamic debugging is not enabled, kernel KERN_DEBUG type logging is either always off or always on until the next time kernel Image is recompiled to make changes, and cannot be adjusted at runtime.
After dynamic debugging is enabled, the information of the KERN_DEBUG level of the specified driver file, that is, the information of pr_debug(), dev_dbg(), print_hex_dump_debug(), print_hex_dump_bytes(), printk(KERN_DEBUG “XXX“) can be printed to the console.
By default, Linux kernel does not enable dynamic debugging. If it is enabled, you need to set CONFIG_DYNAMIC_DEBUG=Y (default is N) and CONFIG_DEBUG_FS=Y (default is Y) in imx_v8_defconfig or menuconfig. After the setting is successful, compile it into a new kernel image and upload it to the TFTP directory of the board in the same way.
3.1 If the user wants to view the KERN_DEBUG level print information of a driver file when the kernel is running, the following command can be used to view the KERN_DEBUG information of drivers/gpu/drm/bridge/sec-dsim.c, where "pfl" is flags, p represents print log information, f represents print function name, and l represents print code line number:
echo -n "file drivers/gpu/drm/bridge/sec-dsim.c +pfl " >
/sys/kernel/debug/dynamic_debug/control
dmesg |grep sec

Checked the source code of the Linux drivers/gpu/drm/bridge/sec-dsim.c driver, you can see that the dev_dbg information has been printed.


3.2 If the user wants to view the KERN_DEBUG level print information of a driver file when the kernel is started, and there is a development board offline, you can modify bootargs in the following way. The following code modifies drivers/gpu/drm/bridge/sec-dsim.c, and needs to modify dtb and connect an external MIPI DSI panel:
edit: setenv bootargs ${jh_clk} ${mcore_clk} console=${console} root=${mmcroot} "dyndbg=\"file drivers/gpu/drm/bridge/sec-dsim.c +pfl"\"
u-boot=> saveenv
Saving Environment to MMC... Writing to MMC(1)... OK
u-boot=>
After starting the kernel, enter dmesg and you can see the following log:

Checked the source code of the Linux drivers/gpu/drm/bridge/sec-dsim.c driver, you can see that the dev_dbg information has been printed.
4. Static debug:
If the user does not need to control the opening and closing of the Linux kernel KERN_DEBUG type log at runtime like dynamic debugging, static debugging can be used. This debugging method requires recompiling Linux kernel to make changes. Specifically, you need to add #define DEBUG to the header of the driver file you want to print.
Still taking the driver file drivers/gpu/drm/bridge/sec-dsim.c as an example, modify the kernel and recompile it as follows. Upload it to the TFTP directory of the AIoT lab development board.
diff --git a/drivers/gpu/drm/bridge/sec-dsim.c b/drivers/gpu/drm/bridge/sec-dsim.c
index fc9ca98f6ef7..a042be9c713c 100644
--- a/drivers/gpu/drm/bridge/sec-dsim.c
+++ b/drivers/gpu/drm/bridge/sec-dsim.c
@@ -14,6 +14,7 @@
* GNU General Public License for more details.
*/
+#define DEBUG
#include <asm/unaligned.h>
#include <linux/clk.h>
#include <linux/completion.h>
Even without setting CONFIG_DYNAMIC_DEBUG=Y, you can also output KERN_DEBUG level print information to the console to achieve the same effect as dynamic debugging:

5. Modify the kernel top-level Makefile to output the dev_dbg, pr_debug, etc. of all driver files to the console (serial port):
The above dynamic debug and static debug methods require user clear which driver file need to be debugged. If there is a problem during startup (such as hang at startup), or there are many files to debug, or it is impossible to locate which file the problem occurs in at the beginning of debugging, we hope to output the KERN_DEBUG type logs of all files in the build-in to the console. How to debug in this case?
We can add -DDEBUG after KBUILD_CFLAGS in the top-level Makefile of the Linux kernel. It will set the DEBUG macro to a defined state, which is equivalent to adding #define DEBUG to all function headers. The specific changes are as follows:
diff --git a/Makefile b/Makefile
index cffb83d7a0fb..1837d6f43a0e 100644
--- a/Makefile
+++ b/Makefile
@@ -570,7 +570,7 @@ KBUILD_CFLAGS := -Wall -Wundef -Werror=strict-prototypes -Wno-trigraphs \
-fno-strict-aliasing -fno-common -fshort-wchar -fno-PIE \
-Werror=implicit-function-declaration -Werror=implicit-int \
-Werror=return-type -Wno-format-security \
- -std=gnu11
+ -std=gnu11 -DDEBUG
KBUILD_CPPFLAGS := -D__KERNEL__
KBUILD_RUSTFLAGS := $(rust_common_flags) \
--target=$(objtree)/rust/target.json \
After making the above changes, compilation Image may take a long time, especially "make -j$(nproc)". You can use the "make Image" command to compile only the kernel image without compiling the kernel module.
After replacing the kernel image, it takes a long time to boot into the file system, about 230 seconds. A large number of irrelevant and repeated logs will appear in the process, which may affect the boot sequence and even cause login failure. However, these logs can still help us to solve problems during the boot process.

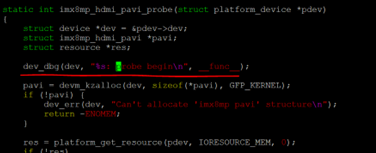
Checked the source code of the Linux drivers/gpu/drm/imx/imx8mp-hdmi-pavi.c driver, you can see that the dev_dbg information has been printed.
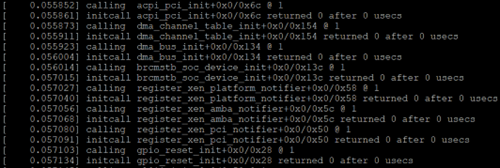
6. Use initcall_debug to track initcall:
During the Linux kernel startup process, the initialization function is called through the initcall mechanism. initcall_debug is a kernel parameter that can track initcall and is used to locate kernel initialization problems.
If the user has a development board offline, can use the following command to modify bootargs to enable initcall_debug:
setenv mmcargs "${mmcargs} initcall_debug loglevel=8"
saveenv
You can see that the initcall information of each function is printed to the console during kernel startup. This information helps us to get more information and locate problems during kernel startup and initialization.
Due to the security restrictions of the AIoT lab, the development board cannot modify bootargs in the U-boot stage, and all are network booted. Users can fix the command line by modifying imx_v8_defconfig in kernel Image according to the following steps:
When you start the board for the first time, find the kernel cmdline in dmesg logs:
console=ttymxc1,115200 root=/dev/nfs ip=dhcp
nfsroot=192.168.100.250:/opt/REAL/NFS/IMX8MPEVK-3-root,v3,tcp
Modify the defconfig file to enable initcall_debug:
diff --git a/arch/arm64/configs/imx_v8_defconfig b/arch/arm64/configs/imx_v8_defconfig
index 85762b37006f..16d8a67b5bd3 100644
--- a/arch/arm64/configs/imx_v8_defconfig
+++ b/arch/arm64/configs/imx_v8_defconfig
@@ -1105,3 +1105,5 @@ CONFIG_CORESIGHT_STM=m
CONFIG_CORESIGHT_CPU_DEBUG=m
CONFIG_CORESIGHT_CTI=m
CONFIG_MEMTEST=y
+CONFIG_CMDLINE_FORCE=y
+CONFIG_CMDLINE="ttymxc1,115200 root=/dev/nfs ip=dhcp
nfsroot=192.168.100.250:/opt/REAL/NFS/IMX8MPEVK-3-root,v3,tcp initcall_debug loglevel=8
You can also see that the initcall information of each function is printed to the console at startup.
7. Debug of other modules: Such as drm debug:
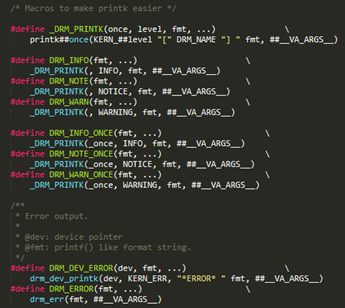
In addition to printk, dev_xxx, pr_xx series of prints, some modules have their own exclusive prints. For example, the Linux DRM subsystem has DRM_DEBUG, DRM_DEBUG_DRIVER, DRM_DEBUG_ATOMIC, DRM_DEBUG_KMS and other prints in its driver. The definitions of these functions are in the include/drm/drm_print.h path, and actually they also call the printk function.
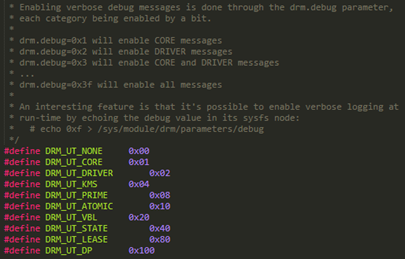
DRM also defines several debug categories, such as:
* drm.debug=0x1 will enable CORE messages
* drm.debug=0x2 will enable DRIVER messages
* drm.debug=0x3 will enable CORE and DRIVER messages
* ...
* drm.debug=0x3f will enable all messages
After Linux boots, run following command:
echo 0x1ff > /sys/module/drm/parameters/debug
Or when compiling the kernel, modify the defconfig file to enable drm debug, which will print all DRM related information to the console for easy debugging of display related issues:
diff --git a/arch/arm64/configs/imx_v8_defconfig b/arch/arm64/configs/imx_v8_defconfig
index 85762b37006f..16d8a67b5bd3 100644
--- a/arch/arm64/configs/imx_v8_defconfig
+++ b/arch/arm64/configs/imx_v8_defconfig
@@ -1105,3 +1105,5 @@ CONFIG_CORESIGHT_STM=m
CONFIG_CORESIGHT_CPU_DEBUG=m
CONFIG_CORESIGHT_CTI=m
CONFIG_MEMTEST=y
+CONFIG_CMDLINE_FORCE=y
+CONFIG_CMDLINE="ttymxc1,115200 root=/dev/nfs ip=dhcp
nfsroot=192.168.100.250:/opt/REAL/NFS/IMX8MPEVK-3-root,v3,tcp drm.debug=0x1FF loglevel=8"
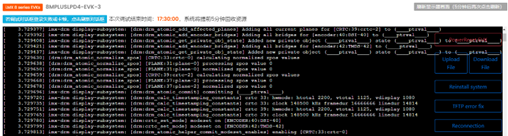
After startup, DRM debug related information can be seen.
8. Manual WARN_ON(1), BUG_ON(1) to view the stack backtrace:
There are BUG_ON() and WARN_ON() statements in the kernel. When the conditions in the brackets are met, an oops message will be thrown. We can use this as a debugging technique. If we want to know how a function in the kernel is called, we can add a WARN_ON(1) to the function and observe its calling relationship:
diff --git a/drivers/gpu/drm/bridge/sec-dsim.c b/drivers/gpu/drm/bridge/sec-dsim.c
index fc9ca98f6ef7..42f647c14e2e 100644
--- a/drivers/gpu/drm/bridge/sec-dsim.c
+++ b/drivers/gpu/drm/bridge/sec-dsim.c
@@ -1146,6 +1146,7 @@ struct dsim_pll_pms *sec_mipi_dsim_calc_pmsk(struct sec_mipi_dsim *dsim)
struct sec_mipi_dsim_range pr_new = *prange;
struct sec_mipi_dsim_range sr_new = *srange;
+ WARN_ON(1);
pll_pms = devm_kzalloc(dev, sizeof(*pll_pms), GFP_KERNEL);
if (!pll_pms) {
dev_err(dev, "Unable to allocate 'pll_pms'\n");